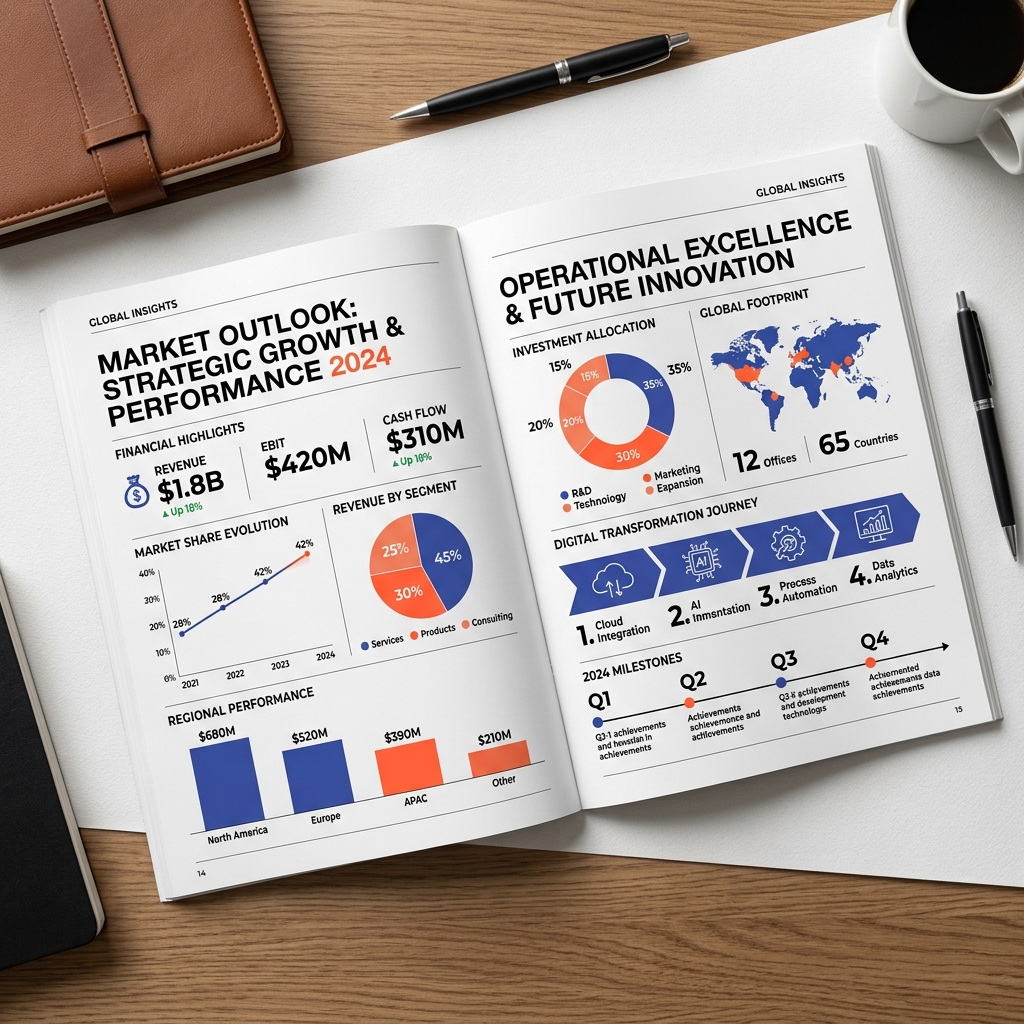
// INFOGRAPHIC DESIGN SERVICES

Complex Information, Designed to Be Understood.

We transform complex raw data, deep research data, process workflows, and structural corporate reports into clean, visual stories that capture B2B authority.
[01 // NARRATIVE DATA] [02 // STRUCTURE] [03 // VISUAL HIERARCHY]
Visualize Your Data Explore Design Rules
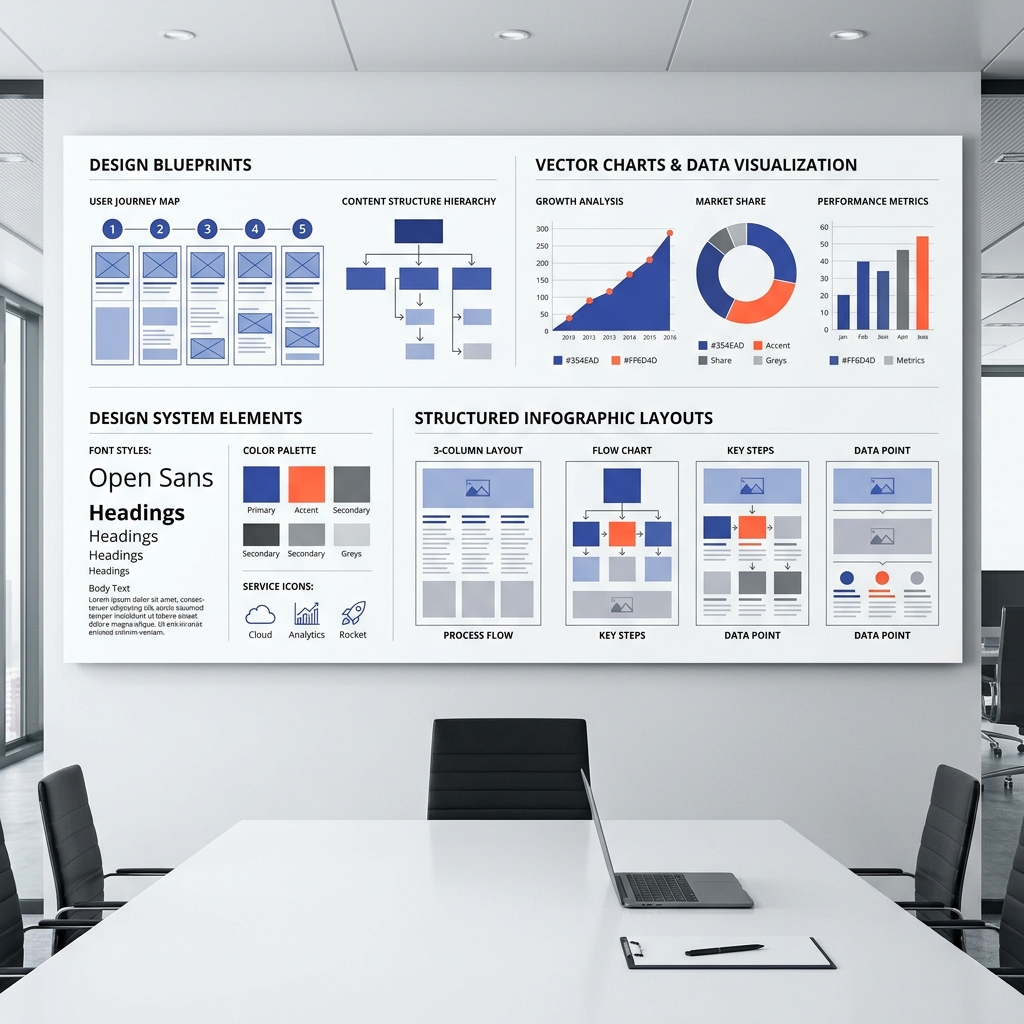
Creative studio board showing structured infographics design blueprints
// DEFINITION

Translating Complexity into Narrative

Infographic design combines raw information, structured data visualization, technical typography, and narrative graphics to make complex subjects easily comprehensible for decision makers.

01. RAW INFORMATION

Messy lists, unformatted text documents, data sheets, and raw research briefs.

02. CONTENT STRUCTURE

Grouping concepts, mapping information hierarchy, and establishing narrative sequences.

03. VISUAL HIERARCHY

Applying size scale, layouts, custom icons, and technical diagrams to guide focus points.
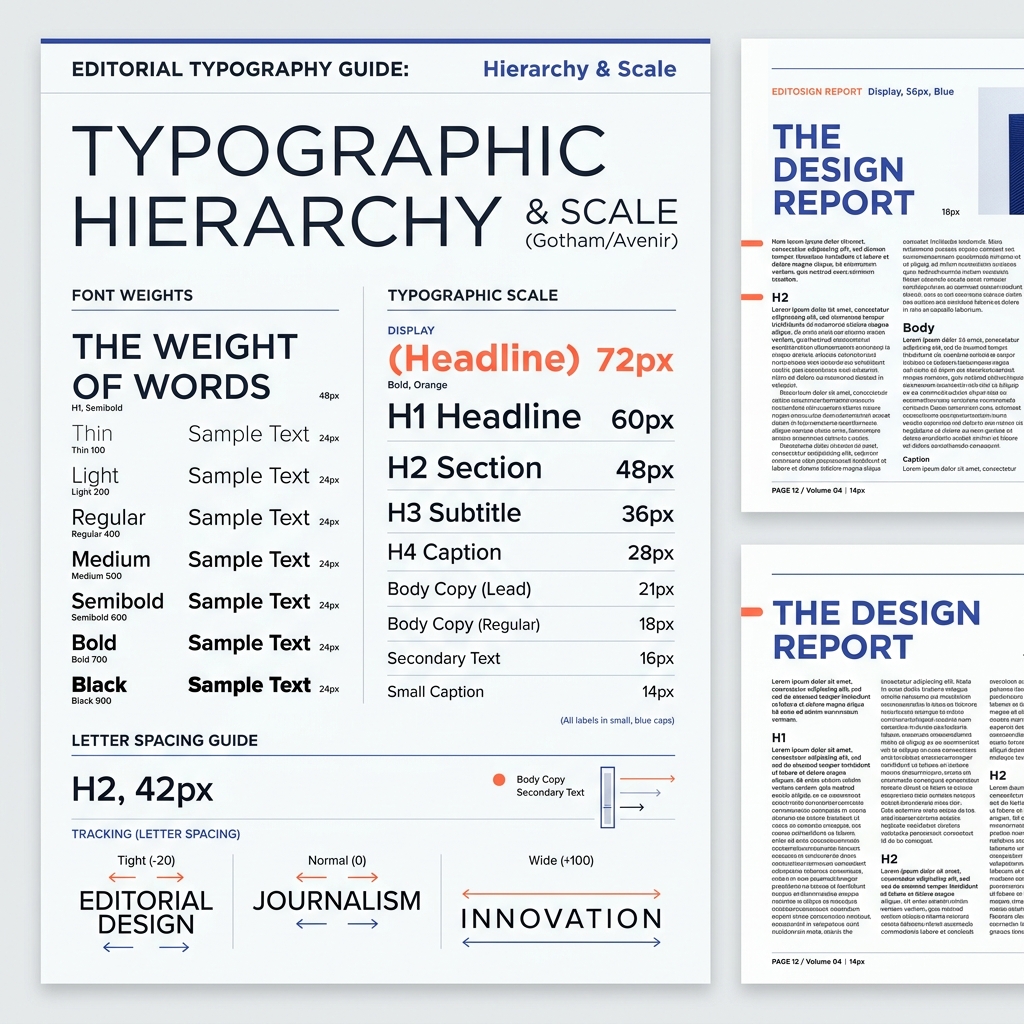
Editorial typography scale and hierarchy rules demonstration
04. GRAPHIC NARRATIVE

Final design composition delivered in print or digital vector formats ready to publish.

// THE SYSTEM BOARD

Visual Formatting Blueprint Index

Select a format layout from our architectural spec index to review its visual anatomy and typical use cases.

[FORMAT SPEC: DATAVIZ]

Data Visualization & Charts

Transforms numerical data sheets into clean graphs, bar layouts, line progressions, and donut visual systems.
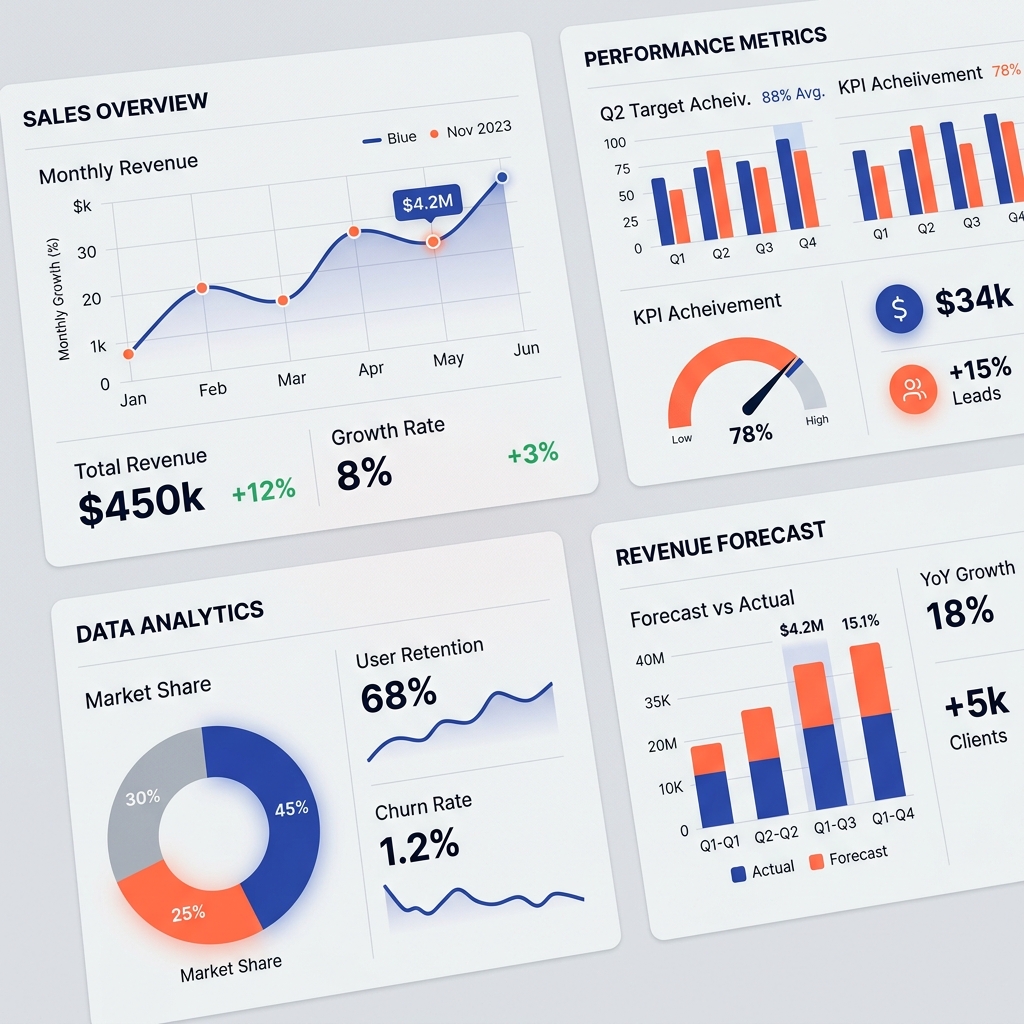
BEST USE CASE Survey summaries, investor slide decks, metric updates
RECOMMENDED GRID Asymmetric grid, 16:9 landscape / A4 corporate reports
Clean visual charts and custom graphs closeup
// THE DATA CANVAS

Custom Brand Color Data Canvas

Raw corporate metrics shouldn't look like generic spreadsheet outputs. We map out data using specific colors, line weights, and clean grids to fit brand requirements. Switch themes below to see how a chart updates dynamically:

// OPERATION DIAGRAMS

Business Workflow & Operational Flows

Convert multi-page process descriptions or customer journeys into single-page workflow diagrams. We outline step sequences so teams understand operations in a glance.
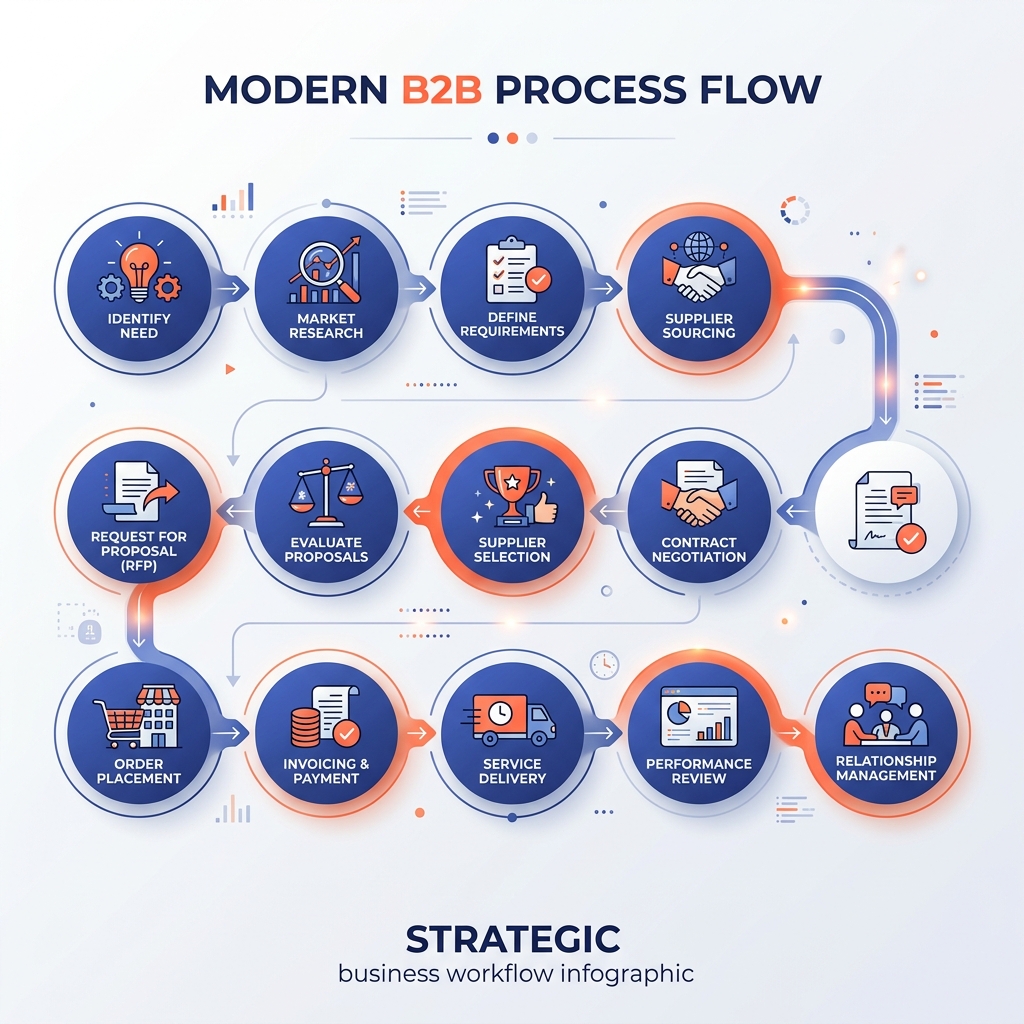
STAGE 01

1. Intake & Data Extraction

Collating spreadsheet CSV files, raw copywriting briefs, and target B2B specifications.
STAGE 02

2. Structural Hierarchy Mapping

STAGE 03

3. Custom Illustration & Grids

Clean visual flow charts showing process timeline structures
// THE CHRONICLE

Milestones & Chronicle Timelines

Organize business histories, historical milestones, project launch deliverables, and product roadmap schedules across clear timeline connectors.
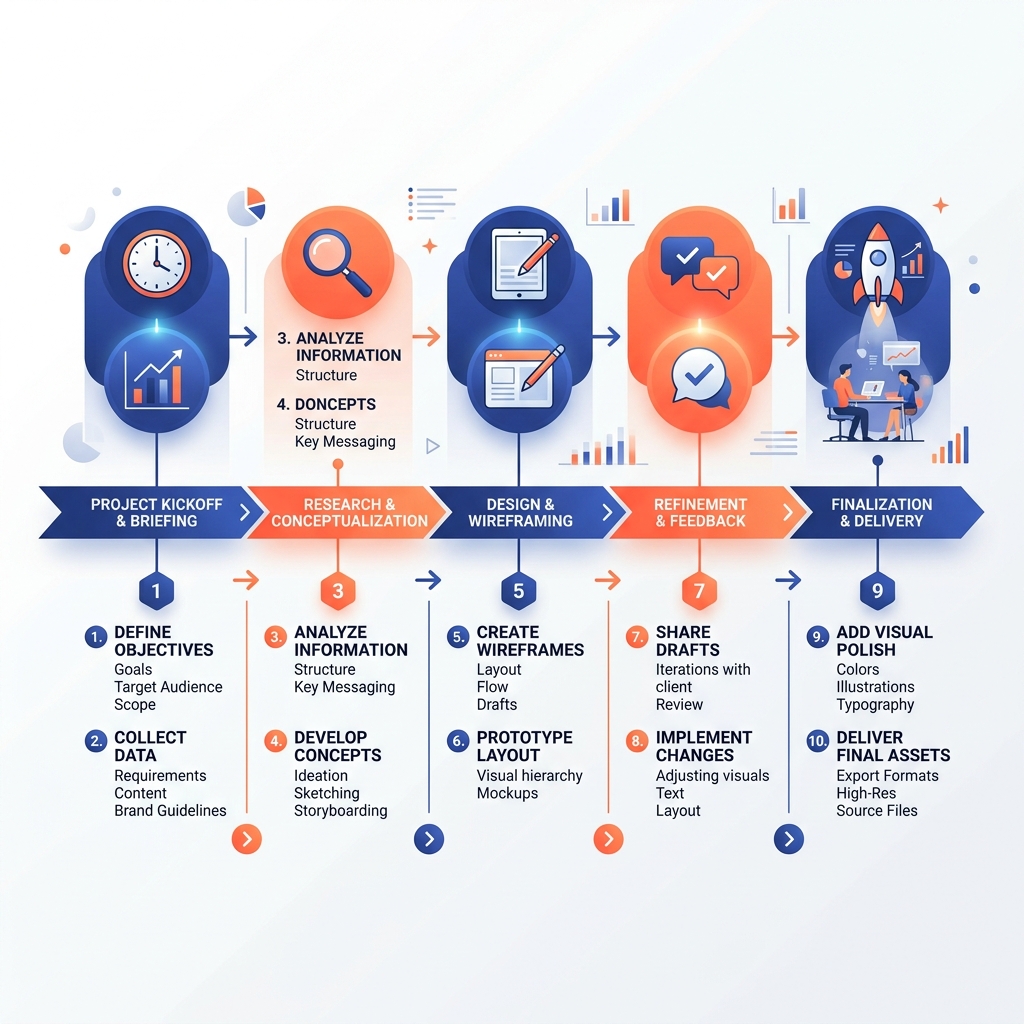
Chronological timeline visual layouts preview

Launch Phase (M1)

Mapping visual benchmarks and extracting raw data sources from client assets.

Wireframing Grid (M2)

Structuring layout wireframes to test accessibility heights before drafting vectors.

Vector Delivery (M3)

Releasing high-resolution print PDF profiles, web SVG assets, and source AI datasets.

// METRIC COMPARISON

Visual VS Matrices & Comparison Layouts

Instead of forcing users to scan heavy paragraph blocks to evaluate feature metrics, we build high-contrast visual comparison tables designed for rapid B2B decision-making.
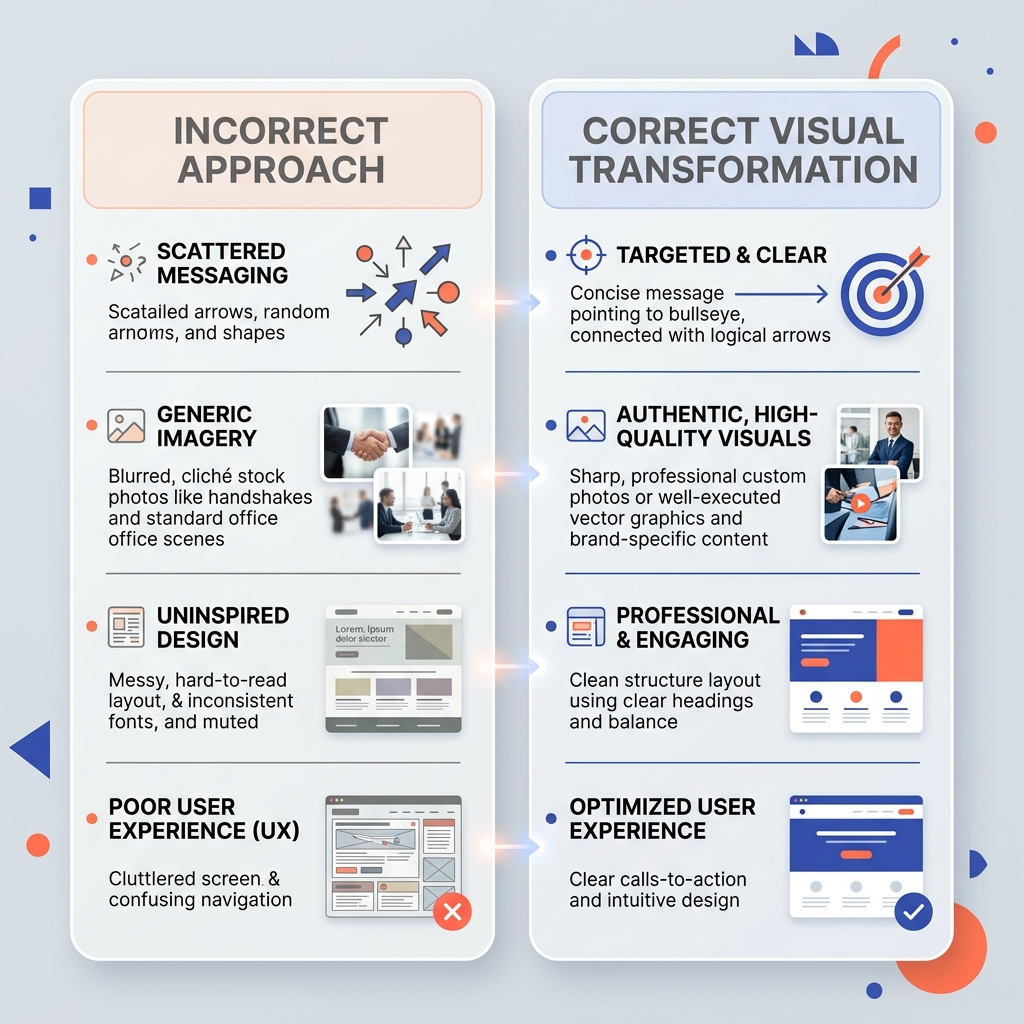
Comparison Check NITIX Digital Co. Standard Agency
Custom Iconography ✔ 100% Unique ✖ Template Stock
Source Files Included ✔ AI / Figma / SVG ✖ Flattened PNG only
Data Research ✔ Verified Structuring ✖ Client draft dependent
Comparison infographic visual structures closeup
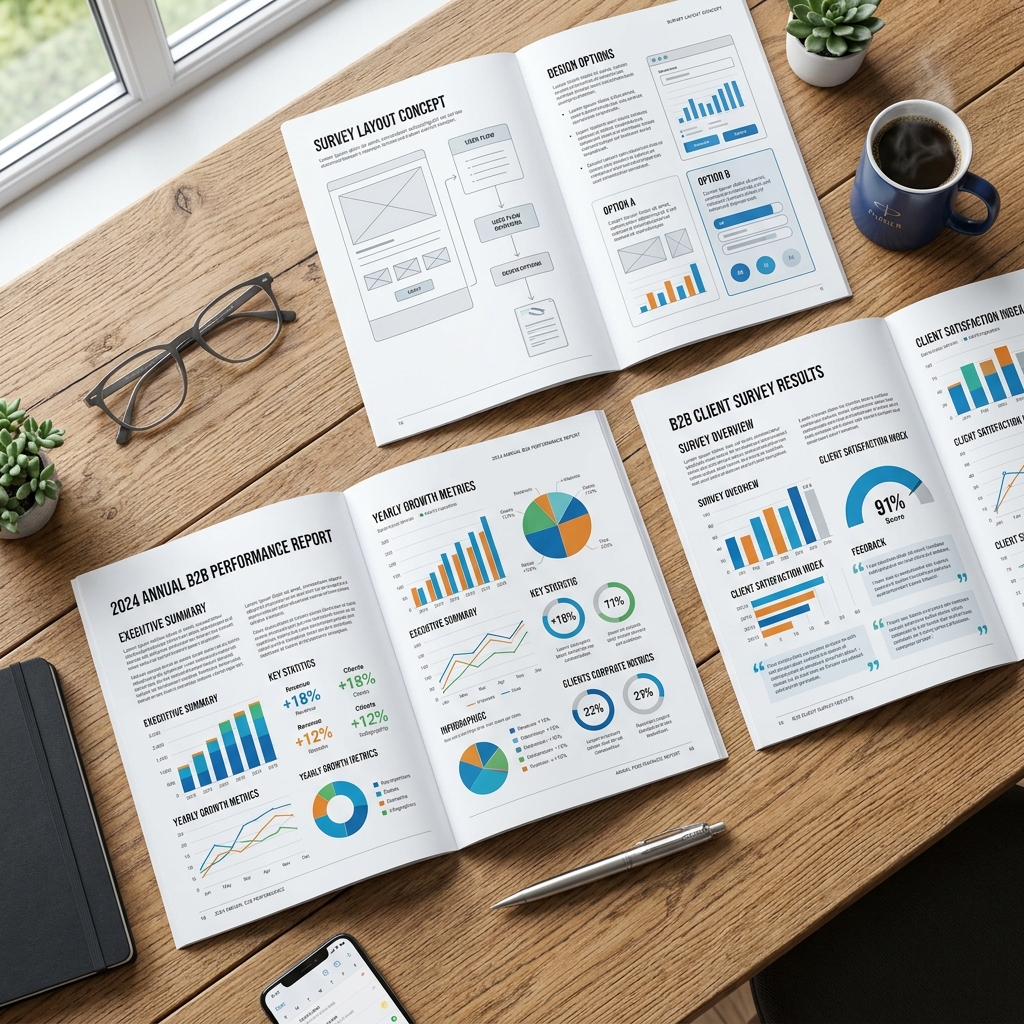
Annual B2B reports and survey layout mockups open on a table
Editorial infographic layouts showcase in premium magazine spread format
// B2B CORPORATE MEDIA

Annual Corporate Reports & Slide Graphics

Make investor briefs, survey findings, research papers, and corporate decks look like high-end print publications. We structure metrics so stakeholders spot key takeaways in under 5 seconds.

"Visualizing survey metrics increases corporate report reader retention by up to 65% compared to raw text appendices."
// DIAGRAM BLUEPRINTS

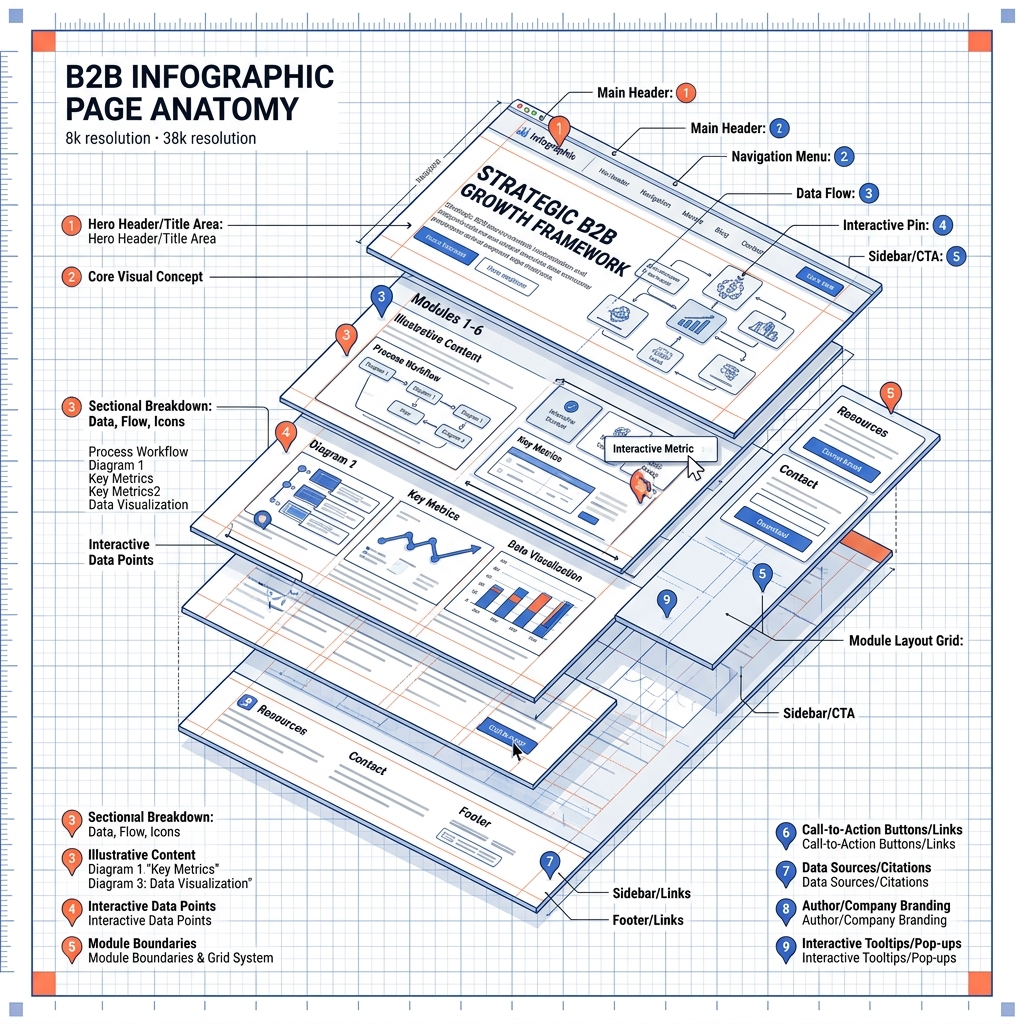
Interactive Anatomy of a B2B Infographic

Click on the highlighted pins on our diagram mockup below to learn the structural rules we follow during production.

Exploded diagram mockup of infographic design layouts
A
B
C
// THE TRANSFORMATION

From Messy Text to Visual Clarity

Toggle the options below to see how raw, complex textual paragraphs are converted into structured graphic blocks.

[BEFORE: MESSY DATA]

"The survey shows that 74% of buyers prefer infographics because of time limits, whereas 15% read text documents and the remaining 11% rely on slide highlights, meaning visual communication represents a major asset."

[AFTER: NITIX DIGITAL STRUCTURE]

✦ Visual Graphics Prefers: 74%
✦ Text Readers: 15%
✦ Presentation Slides: 11%
// THE METHOD

Structured Design Timeline Process

A workflow calibrated to balance information precision with creative visual design.

01

Information Research

Auditing datasets, reading research whitepapers, and refining copy titles.

02

Hierarchy Wireframe

Drafting structure sketches, mapping process flows, and checking spacing grids.

03

Visual System & Delivery

Designing custom icon assets, matching brand colors, and rendering final vectors.
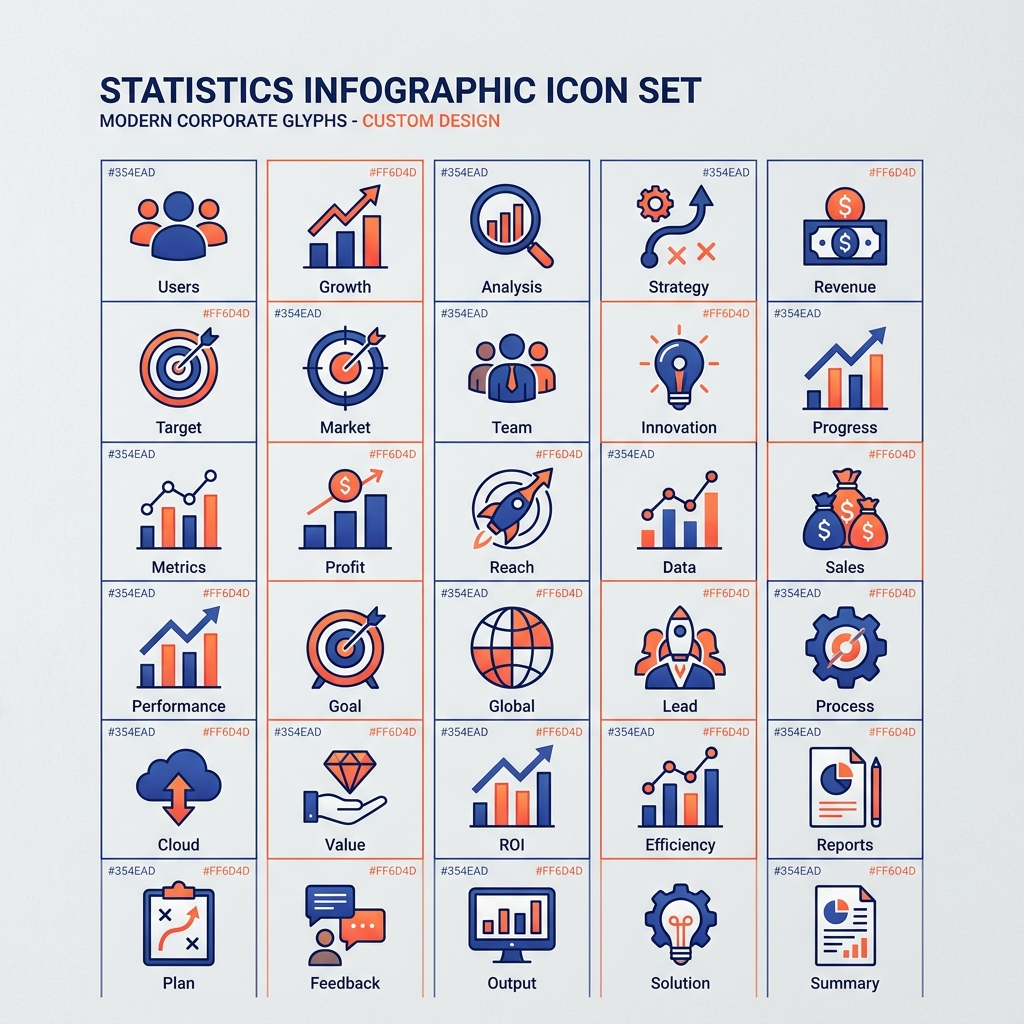
Custom designed vector icon set for infographic statistics visualization
// LAYOUT ADAPTATION

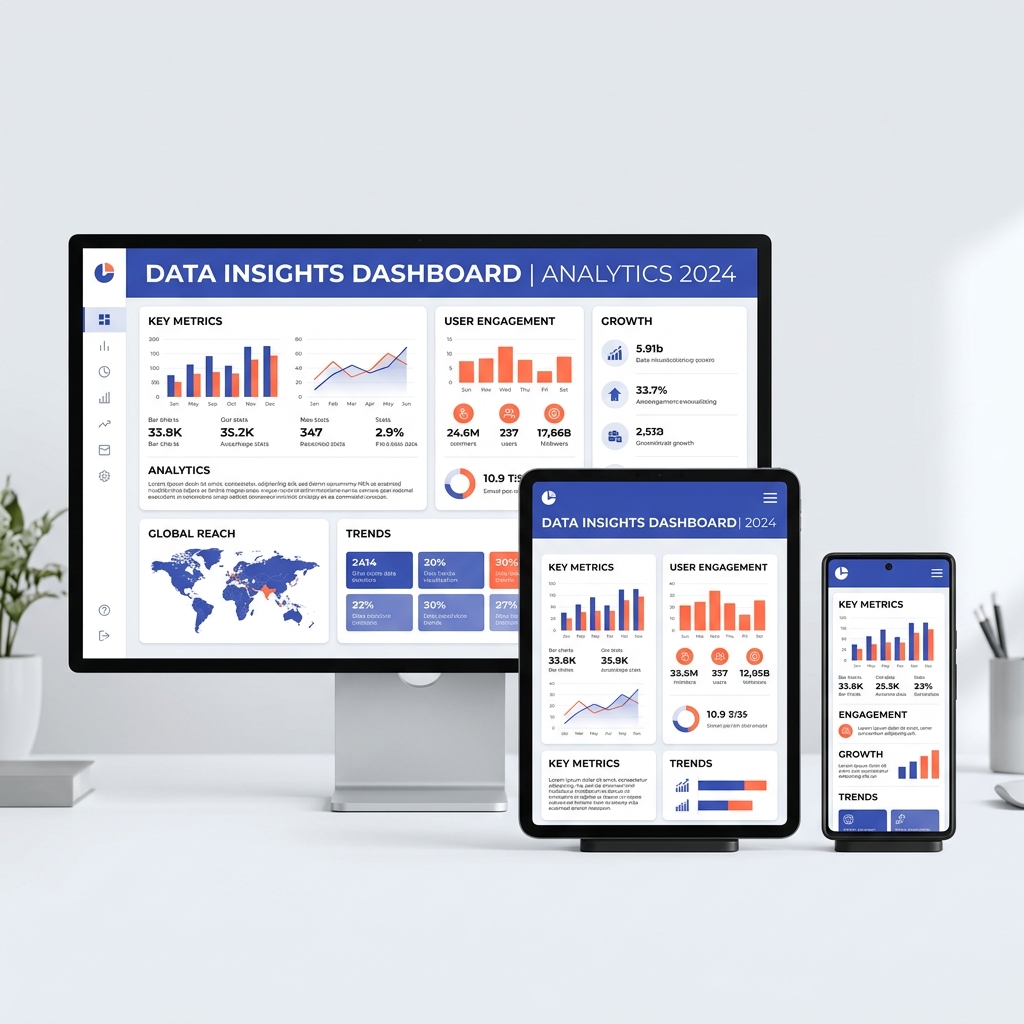
Responsive Layout Adapters

Infographic assets should adapt to their display channels. We build designs optimized for A4 print reports, Keynote/PowerPoint presentation slides, web page bodies, and mobile portrait feeds.

Infographics scaling across desktop, tablet, and phone screen dimensions
// THE SPEC SHEET

Technical Delivery Specifications

We package design deliverables to fit digital displays and high-resolution print requirements perfectly.

RESOLUTIONS & COLORS

300 DPI CMYK vectors for print reports, and optimized 72/150 DPI RGB files for web and social feeds.

FILE FORMATS

Print PDF masters, web SVG vector layouts, and high-fidelity PNG/JPG previews for presentations.

SOURCE DATASETS

Fully layered vector source files in Adobe Illustrator (.ai), EPS formats, or Figma files based on project scope.

// APPLICATIONS

Target Industry Applications

We build technical infographics suited for specific industry communication channels.

Technology & Software

Visualizing network stack structures, data APIs, cloud architecture security layers, and product workflows.

Finance & Investment

Quarterly market trends, metric asset growth reports, survey statistics, and investor pitch deck timelines.

Healthcare & Science

Exploding anatomical systems, process diagnostics maps, clinical trial sequences, and research visual summaries.

// THE ADVANTAGE

Why Collaborate With NITIX Digital Co.

We treat design as visual logic, mapping layouts to match datasets accurately while aligning with brand parameters.

Information-First Logic

We study your source copywriting sheets, verify numbers, and design visual paths before vector rendering begins.

Brand Style Sheets Matching

Applying custom color presets, grid systems, and technical line hierarchies that fit your existing identity documents.

100% Vector Precision

We deliver fully scalable vector outputs (SVG/AI) so layouts remain crisp across billboard sizes or smartphone feeds.

Senior visual infographic designer planning layout wireframes at drawing desk
// PROJECT SYSTEM

Conceptual Design Case Study

Explore how we converted complex logistics metrics into a clean, horizontal corporate timeline layout.

CONCEPT STUDY // LOGISTICS SYSTEM

Global Supply Chain Mapping

Challenge: Explaining a multi-tier distribution model to non-technical B2B investors by highlighting key transit nodes and data volume bottlenecks.

Design team evaluating logistics layout blueprints
1. Audit

Extracting data points from a 45-page logistics PDF document.

2. Wireframing

Sketching process timeline routes and node sizes before coding vectors.

3. Designing

Designing custom logistics icons, connecting nodes, and color grading chart blocks.

4. Output

Delivered editable AI master, print PDF profiles, and presentation crops.

// DESIGN QUESTIONS

Infographic Design FAQ

Clear, structural answers regarding NITIX Digital Co.'s infographic design process, tools, deliverables, and timelines.

What is infographic design?
Infographic design is the practice of combining information, statistics, hierarchy, custom iconography, and visual storytelling to make complex datasets or workflows simple and engaging to digest.
What types of infographics do you create?
We create data visualizations, statistical sheets, horizontal and vertical process timelines, comparison matrices, anatomical diagrams, B2B annual report layouts, and multi-format social graphic slices.
Can you turn my raw data into an infographic?
Yes. Our team can review raw Excel sheets, Word documents, research papers, or PDF files. We analyze the content, pull out the key metrics, and structure them into a clear visual flow.
Do you provide editable source files?
Yes, we deliver fully editable vector source files in Adobe Illustrator (.ai), EPS, PDF, or Figma formats based on project onboarding requirements.
Can you design infographics for corporate reports?
Yes, we design custom infographics for B2B annual reports, investor briefs, research whitepapers, and presentation decks to make metrics easy for stakeholders to digest.
How long does infographic design take?
Standard static infographics typically take 1–2 weeks from initial data audit to final delivery, depending on complexity. Larger corporate reports requiring multiple layouts may take 3–4 weeks.
// WORK WITH NITIX DIGITAL

Have Complex Information to Communicate? Let's Visualize It.

Submit your raw copywriting files, data points, or project ideas below. Our creative directors will review your layout parameters and follow up with a custom design strategy.

Corporate branding design consult session discussing custom infographic metrics layouts